The Agentic Business Intelligence
platform anyone can use
Delivering extraordinary answers from advanced analytics to simple questions — the end-to-end platform turning data into decisions.
Monday performance review? Already done
Agents that prepare and turn your data into knowledge end-to-end, even while you sleep.
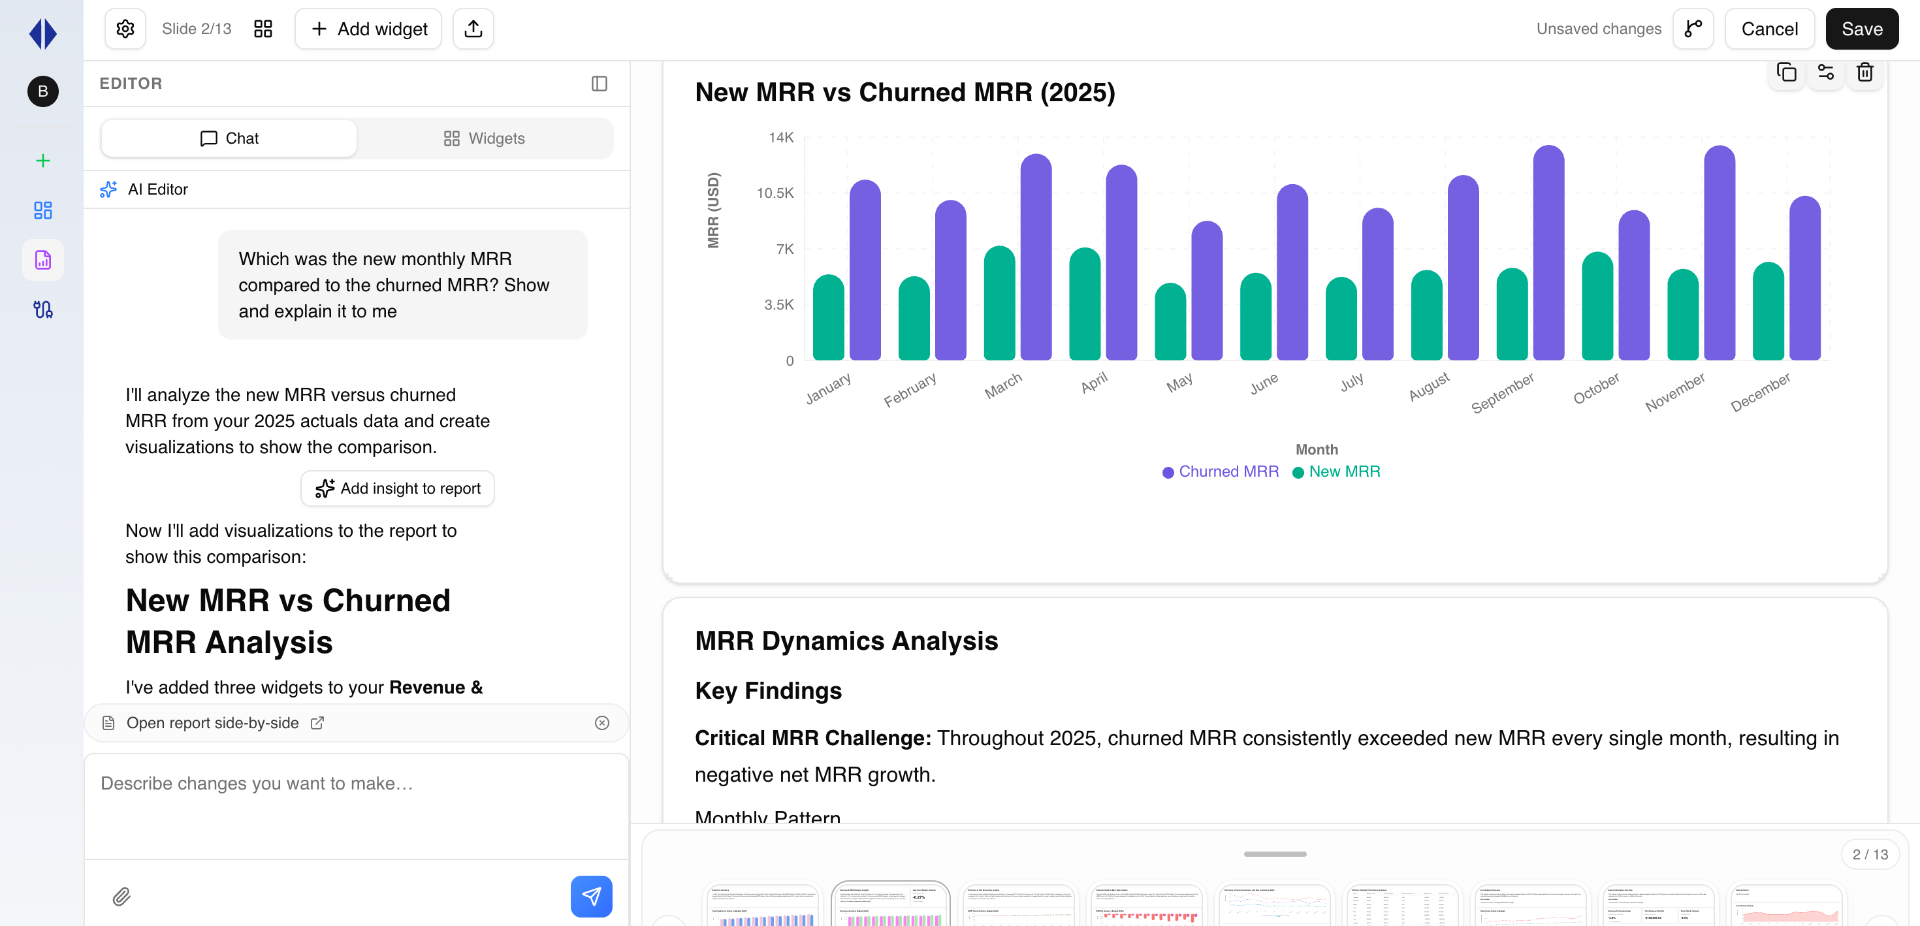
Net New MRR — This Week vs Last Week
(New + Expansion) − (Churn + Contraction)
MRR Dynamics Analysis
Key Findings
Net New MRR up 14% WoW: Net New MRR is up 14% week-over-week, driven mostly by stronger expansion from existing accounts. New business held steady, while churn ticked down slightly. Contraction remains the main drag — worth a closer look at mid-market accounts downgrading seats.
Traditional BI wasn't built for you.
Dashboards nobody opens. Spreadsheets that break. Answers that take three days.
Connect with your data
Plug in your sources in seconds. Your data stays where it lives, ready to be queried by the AI agents.
Connected sources
6 activeSnowflake
Connected
BigQuery
Connected
Postgres
Connected
Stripe
Syncing
HubSpot
Connected
Google Sheets
Connected
Ask
Get the answer — chart, context, and what to do next, within seconds.
Revenue dropped 8.2% in March, driven by churn in the Mid-Rim region. Here's the breakdown:
Revenue by region (Mar)
Share and collaborate
Share a live link. Your team asks, builds and decides — together.
Q3 FY24 · Investor Update
ARR
$24.6M
+38% YoY
NRR
127%
+6 pts QoQ
Gross Margin
78%
+2 pts
ARR growth vs Burn ($K)
ARR reached $24.6M (+38% YoY) with NRR at 127%. Burn multiple improved to 0.7x — runway extended to 28 months at current pace.
Executive Sum…
ARR & Bookin…
Burn & Runwa…
Cohort Reten…
Pipeline & Fo…
The data you already have, now connected and understandable
Your tools, seamlessly connected in seconds. No exports, no copy-pasting, no SQL needed.

'%3e%3cg%20id='meta_line'%20transform='translate(480.000000,%200.000000)'%3e%3cpath%20d='M24,0%20L24,24%20L0,24%20L0,0%20L24,0%20Z%20M12.5934901,23.257841%20L12.5819402,23.2595131%20L12.5108777,23.2950439%20L12.4918791,23.2987469%20L12.4918791,23.2987469%20L12.4767152,23.2950439%20L12.4056548,23.2595131%20C12.3958229,23.2563662%2012.3870493,23.2590235%2012.3821421,23.2649074%20L12.3780323,23.275831%20L12.360941,23.7031097%20L12.3658947,23.7234994%20L12.3769048,23.7357139%20L12.4804777,23.8096931%20L12.4953491,23.8136134%20L12.4953491,23.8136134%20L12.5071152,23.8096931%20L12.6106902,23.7357139%20L12.6232938,23.7196733%20L12.6232938,23.7196733%20L12.6266527,23.7031097%20L12.609561,23.275831%20C12.6075724,23.2657013%2012.6010112,23.2592993%2012.5934901,23.257841%20L12.5934901,23.257841%20Z%20M12.8583906,23.1452862%20L12.8445485,23.1473072%20L12.6598443,23.2396597%20L12.6498822,23.2499052%20L12.6498822,23.2499052%20L12.6471943,23.2611114%20L12.6650943,23.6906389%20L12.6699349,23.7034178%20L12.6699349,23.7034178%20L12.678386,23.7104931%20L12.8793402,23.8032389%20C12.8914285,23.8068999%2012.9022333,23.8029875%2012.9078286,23.7952264%20L12.9118235,23.7811639%20L12.8776777,23.1665331%20C12.8752882,23.1545897%2012.8674102,23.1470016%2012.8583906,23.1452862%20L12.8583906,23.1452862%20Z%20M12.1430473,23.1473072%20C12.1332178,23.1423925%2012.1221763,23.1452606%2012.1156365,23.1525954%20L12.1099173,23.1665331%20L12.0757714,23.7811639%20C12.0751323,23.7926639%2012.0828099,23.8018602%2012.0926481,23.8045676%20L12.108256,23.8032389%20L12.3092106,23.7104931%20L12.3186497,23.7024347%20L12.3186497,23.7024347%20L12.3225043,23.6906389%20L12.340401,23.2611114%20L12.337245,23.2485176%20L12.337245,23.2485176%20L12.3277531,23.2396597%20L12.1430473,23.1473072%20Z'%20id='MingCute'%20fill-rule='nonzero'%3e%3c/path%3e%3cpath%20d='M8.06925,5.00237%20C6.47461,4.89183%205.20472,5.81816%204.31715,6.9809%20C3.42438,8.15046%202.79487,9.7015%202.44783,11.2489%20C2.10089,12.7959%202.01419,14.4379%202.29341,15.813%20C2.56477,17.1493%203.25726,18.5227%204.71368,18.9581%20C6.10192,19.3731%207.34848,18.783%208.30022,17.9824%20C9.25406,17.18%2010.0806,16.0364%2010.7459,14.9309%20C11.2678,14.0637%2011.7139,13.1803%2012.0636,12.4265%20C12.4134,13.1803%2012.8595,14.0637%2013.3814,14.9309%20C14.0467,16.0364%2014.8732,17.18%2015.8271,17.9824%20C16.7788,18.783%2018.0254,19.3731%2019.4136,18.9581%20C20.87,18.5227%2021.5625,17.1493%2021.8339,15.813%20C22.1131,14.4379%2022.0264,12.7959%2021.6795,11.2489%20C21.3324,9.7015%2020.7029,8.15046%2019.8101,6.9809%20C18.9226,5.81816%2017.6527,4.89183%2016.058,5.00237%20C14.3243,5.12255%2013.0879,6.47059%2012.3715,7.49%20C12.2613,7.64685%2012.1586,7.80273%2012.0636,7.95456%20C11.9687,7.80273%2011.866,7.64685%2011.7558,7.49%20C11.0394,6.47059%209.803,5.12255%208.06925,5.00237%20Z%20M10.9193,10.0265%20C10.6371,10.7417%209.95004,12.3747%209.03232,13.8996%20C8.41066,14.9325%207.71866,15.8581%207.01275,16.4519%20C6.30475,17.0474%205.7503,17.1805%205.28652,17.0419%20C4.89094,16.9236%204.46993,16.4812%204.25341,15.415%20C4.04476,14.3875%204.0958,13.0402%204.39936,11.6866%20C4.70282,10.3335%205.23656,9.07262%205.90692,8.19443%20C6.58247,7.30944%207.27559,6.95216%207.93095,6.99758%20C8.69718,7.0507%209.46077,7.70266%2010.1194,8.63992%20C10.487,9.16295%2010.7616,9.6916%2010.9193,10.0265%20Z%20M13.208,10.0265%20C13.4902,10.7417%2014.1773,12.3747%2015.095,13.8996%20C15.7166,14.9325%2016.4086,15.8581%2017.1145,16.4519%20C17.8226,17.0474%2018.377,17.1805%2018.8408,17.0419%20C19.2364,16.9236%2019.6574,16.4812%2019.8739,15.415%20C20.0825,14.3875%2020.0315,13.0402%2019.7279,11.6866%20C19.4245,10.3335%2018.8907,9.07262%2018.2204,8.19443%20C17.5448,7.30944%2016.8517,6.95216%2016.1963,6.99758%20C15.4301,7.0507%2014.6665,7.70266%2014.0079,8.63992%20C13.6403,9.16295%2013.3657,9.6916%2013.208,10.0265%20Z'%20id='形状'%20fill='%2309244B'%3e%3c/path%3e%3c/g%3e%3c/g%3e%3c/g%3e%3c/svg%3e)

The answers you need — before you even have to ask for it
When you're not asking, you can set Strathens to keep working for you. Schedule analyses, share them with your team and bring the insights they need to decide.
Scheduled
Set it once. Reports run on the cadence your team needs.
Auto-shared
Insights delivered to the right inbox or channel automatically.
Proactive alerts
Get notified the moment a metric moves outside expectations.
AI-curated
Agents surface the answers worth acting on, not just numbers.
One definition for everyone. No more misaligned data
Set your metrics once, your way — no coding needed. Every report, every dashboard and every team, always aligned.
- Single source of truth for every metric
- Shared definitions across every team
- Live updates whenever logic changes
- No code required to define or evolve them
Your data? Doesn't go anywhere, always secured.
Our main priority. Your data is always private and just accessible for you and your role-based team, we include the highest grade of security.
Start now with our pre-built templates
Discover the new standard for Business Intelligence used by more than 500 teams
Start now with our pre-built templates
Discover the new standard for Business Intelligence used by more than 500 teams
Monthly Revenue
$142.8K
AI Insight: Revenue accelerated 2.4x since June. Agent attributes growth to enterprise upsells in EMEA.
Revenue Trends
Conversion Rate
4.8%
AI Insight: Organic outperforms paid mid-week. Shift ad budget to Mon/Tue for 15% lift.
Conversion Analysis
Customer Segments
Customer Segments
Performance Score
Performance Radar
Enterprise segment shows 18% higher churn risk this quarter
Agent detected a correlation between reduced feature adoption in weeks 3-4 and subsequent churn.
AI Insight — Churn Risk
Anomaly Detected
Spike at 14:00 — API traffic surged 94% above baseline.
Anomaly Detection
Week 8 Retention
53%
Retention Cohorts
Conversion Funnel
Conversion Funnel
Key Metrics — Agent Summary
Active Users
24.8K
+12%Avg Session
8m 42s
+18%Churn Rate
2.4%
-0.3%ARPU
$48.20
+5.1%KPI Dashboard
SMB accounts converting 3.2x faster after onboarding redesign
Your agent cross-referenced signup data with activation metrics and identified the new flow as the driver.
AI Insight — Growth
Agent A vs Agent B
Last 6 weeksAgent Comparison
Monthly Revenue
$142.8K
AI Insight: Revenue accelerated 2.4x since June. Agent attributes growth to enterprise upsells in EMEA.
Revenue Deep Dive
Untapped potential: 42% of users never explore the reports tab
Agent recommends adding contextual prompts. Estimated impact: +$240K ARR if adoption reaches 60%.
AI Insight — Opportunity
Performance Score
Performance Overview
Conversion Funnel